October Investment Perspectives


Wind Shear
Mark Luschini, Chief Investment Strategist
A wind shear is a change in the direction or speed of the prevailing wind occurring over a short distance. For travelers, this phenomenon is often associated with flying, as the plane can be abruptly displaced from its preceding path, requiring the pilot to adjust the flight plan accordingly. Presently, the U.S. economy is operating in relatively clean air. However, it is important to remember that it derives almost 70% of its impulse from consumer spending. Therefore, analyzing the likelihood of it expanding, contracting, speeding up, or slowing down has to be viewed through the prism of households’ propensity to consume.
Over the first three quarters of this year, the economy has expanded at a surprisingly robust pace, largely driven by an above-trend pace of consumption. The factors that have enabled households to spend with such voraciousness include a strong labor market, abundant savings, rising incomes, and falling inflation to name a few. To project forward expectations for economic activity and anticipate what might change its direction, the question to be answered is whether those conditions still exist. If so, then extrapolating from economic activity in the recent past leads one to surmise that positive growth can continue for the foreseeable future and concerns of encountering a wind shear that could endanger its prospects are diminished.
There are, however, gathering forces on the horizon that are troubling. Payroll growth has begun to decelerate. While recent job gains are still occurring at a fairly rapid pace, the unemployment rate has nudged a bit higher, the number of unfilled job openings is dwindling, and wage increases are cooling. To be sure, weekly jobless claims, considered a leading indicator, remain quite low and are far from approaching levels that would evidence a sudden collapse in the labor market. The glut of excess savings is also winding down. The San Francisco Federal Reserve estimates that the current draw on the $2.1 trillion in savings accumulated during the COVID-induced lockdowns and added to by the fiscal transfer programs, may be exhausted by the end of this year. While that does not imply spending will grind to a halt, it does suggest that households may become more discriminate in their consumption behavior.
Wage increases are also being trimmed. After companies adjusted pay scales to reflect inflation, as well as to retain and attract employees, surveys of businesses suggest compensation plans are shifting to a slower rate of increase. If inflation fails to fall further from current levels, that could leave many in the lower wage categories feeling the pinch on an inflation-adjusted basis. Mount on top of that, the restart of student loan repayments and the consumer spending headwind will probably pick up a couple of knots.
Oil prices are higher by almost 30% since the end of June. Meanwhile, the national average gasoline price is over $4 and up more than 10% over a similar period, and the trend, given it mostly follows the price of a barrel of oil, is higher. Falling gas prices were a huge tailwind to start the year, which helped to boost the consumers’ real purchasing power. High and rising gas prices will zap some of that spending, which otherwise might go toward goods and services, some of which are necessities, and may cause households to retrench. A final potential blow to the consumer is that banks are sharply tightening lending standards. While delinquency rates on credit cards and auto loans have started to creep higher, they are only roundly back to pre-pandemic levels. Encouragingly, mortgage loan defaults have barely budged so far. Historically, restrictive lending conditions precede falling retail sales, which in turn would weigh on overall economic activity.
Pilots are trained to course correct in the event of developments that occur outside of the intended flight plan. As of now, we believe the economic picture is still reasonably bright, but there are some storm clouds accumulating on the horizon that could cause us to change our outlook. For equity investors, that means we believe it is premature to turn overly cautious. At the same time, we judge that bonds offer good value for both yield and ballast in a balanced portfolio. In the meantime, stay tuned for further instruction while this economic flight forges.
Yield Curve & Productivity Booms
Guy LeBas, Chief Fixed Income Strategist
The level of interest rates provides useful signals about economic conditions. The shape of the yield curve provides a read-through of the economic future, but changes in the shape of the yield curve provide a read-through to how the markets think the economic future is changing. Generally, there are four major regimes that describe how the yield curve changes over time: bull flattener, bull steepener, bear flattener, and bear steepener. In 2023, the yield curve has cycled through these regimes in seemingly record time, but for the back half of the year, we think a bear steepener remains the biggest risk.
The shape of the yield curve refers to the differential in yields between longer-term bonds and shorter-term ones. A steep yield curve is one in which long-term bonds yield much more than short-term bonds, a normal yield curve is one in which longer-term bonds yield somewhat more than short-term bonds, and an inverted yield curve is one in which longer-term maturities yield less than shorter-term ones. For simplicity’s sake, we often focus on the difference between 10-year and 2-year maturities; the 2s/10s spread charted below is now -0.52%, which we would characterize as “deeply inverted.” The shape of the yield curve changes over time, though we are hard-pressed to recall a year in which the changes have been more dramatic. As the 2s/10s spread chart notes, in 2023, this measure of the yield curve shape has ranged from -1.09% in March (and again in July) to -0.52% today.
Chart 1: Yield Curve is Steepening While Long-Term Rates Are Rising
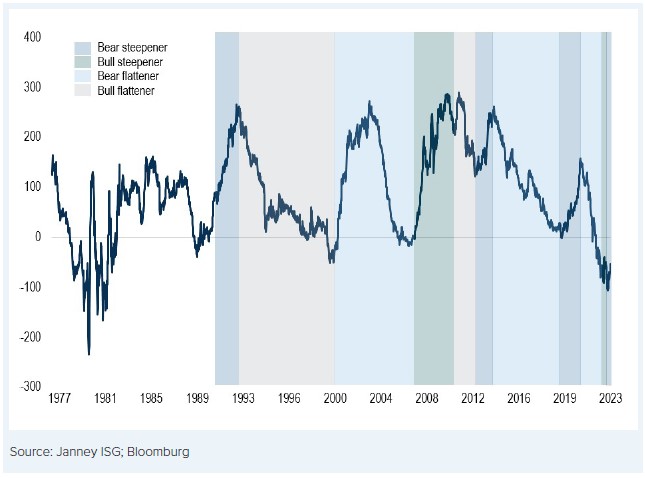
Of the major stages of curve change, we appear to be in a bear steepener. “Bear” refers to interest rates going up (and bond prices down), while steepener refers to the shape of the yield curve becoming less inverted. In other words, a bear steepener occurs when long-term interest rates rise more than short-term interest rates. By contrast, a bear flattener we faced over the summer had 2-year yields rising quickly but long-term ones remaining more stable. Today’s bear steepener has important readthroughs to future economic conditions. There is only one historical precedent of a bear steepener, which started when the yield curve was inverted, and the conditions were so dramatically different then, that the comparison is not worth considering.
First, the changes in the shape of the curve reflect lower probabilities of Fed rate cuts in 2024. Fed officials have long held that the U.S. will require high short-term interest rates for a while before they are confident that inflation risks have subsided. The markets are finally starting to agree more with that proposition. Second, the bear steepener reflects a higher budget deficit for some time to come. In August, the U.S. Treasury Department acknowledged that it would be financing a roughly 6% of GDP deficit with longer-term bond issuance, and that additional supply has contributed to long-term bond yields rising. Hence, much of the bear flattener.
Finally, there are hints of a nascent productivity boom which could allow economic growth to persist much longer than previously thought. If there’s a lower chance of a recession in 2024–2025, there are greater odds of interest rates rising. It is the last potential that is most intriguing. Productivity booms are rare, and often only evident in hindsight, but even the potential of one could reshape the U.S. economy.
If long-term financing costs (i.e., bond yields) rise, capital becomes more expensive; firms have to deploy capital only into higher-return projects, et voila, productivity increases over time. Is a productivity boom outright likely? No, but the odds seem to be increasing, at least based on recent themes in the bond markets.
All's Well That Ends Well
Gregory M. Drahuschak, Market Strategist
The September Investment Perspectives ended by saying, “It is difficult to find specific reasons for September’s often weaker-than-average market performance, but the data make it clear that in many years, being somewhat more cautious in September is wise.”
Being cautious last month was a valuable approach as no major equity index ended the month higher. The Dow Jones Industrial Average, S&P 500, and Nasdaq Compositive ended the month with respective 3.5%, 4.87%, and 5.82% losses. The S&P suffered its 14th worst September decline in the last 73 years.
History suggests that it might be wise to remember that the turn of the calendar page to October ushers in what often is the market’s best time of the year with gains respectively on average in October, November, and December of 0.96%, 1.67%, and 1.42%. This, and an array of other factors, underscore an undeniably positive seasonable bias.
Nonetheless, every final quarter of every year does not end with positive results, as various factors can overwhelm whatever positive influence the calendar might provide.
From our perspective, the market outcome from October 1, 2023 to New Year 2024 rests on the following factors:
- How much energy prices will take from discretionary spending
- The impact of the rising dollar on foreign sales and earnings of multinational U.S. companies
- When the economy will feel the effects of all the Federal Reserve credit tightening done in the last 18 months, and finally
- Will corporate earnings live up to lofty expectations for the final quarter of 2023 and all of 2024?
The market so far has weathered the onslaught of the 28.5% increase for West Texas Intermediate crude oil in the third quarter and the 39% gain since late July. At some point, rising gasoline and home heating prices will take a toll on discretionary spending.
The Dollar Index ended September more than 7% above where it was in mid-July. What companies say about the dollar after they release third-quarter results will be important. No matter how they characterize a rising dollar and its effect, a continued rise in the dollar will be a drag on earnings.
Housing data have been lackluster, with every report citing higher mortgage rates as a factor restraining home buying. Likewise, the automotive industry must contend with the estimated record-setting nearly $750 monthly cost to finance a new car. The long and variable lags in the effects of monetary policy will keep investors wondering when and by how much the Fed’s credit tightening will dampen economic activity and lead to a slowdown or an outright recession.
The market, as usual, will pay close attention to these factors. Still, earnings reports are likely to top everything, especially this month when numerous major firms are slated to report third-quarter earnings.
September closed with the 2023 S&P 500 earnings estimate at $219.22, which if achieved would be flat with 2022 results. The 2024 estimate of $245.40, would be nearly 12% above the 2023 estimate.
From October 3 through October 31, 809 firms will report their third-quarter earnings. These reports take on added importance in our view since reaching the currently expected earnings for next year will require successfully navigating the potential drags on discretionary spending, potentially high interest rates for longer than previously expected, and the possible continuation of the dollar’s appreciation.
Nonetheless, we believe various technical factors as well as seasonable bias suggest that October could provide the setting for increasing equity exposure.
The information herein is for informative purposes only and in no event should be construed as a representation by us or as an offer to sell, or solicitation of an offer to buy any securities. The factual information given herein is taken from sources that we believe to be reliable, but is not guaranteed by us as to accuracy or completeness. Charts and graphs are provided for illustrative purposes. Opinions expressed are subject to change without notice and do not take into account the particular investment objectives, financial situation or needs of individual investors.
The concepts illustrated here have legal, accounting, and tax implications. Neither Janney Montgomery Scott LLC nor its Financial Advisors give tax, legal, or accounting advice. Please consult with the appropriate professional for advice concerning your particular circumstances. Past performance is not an indication or guarantee of future results. There are no guarantees that any investment or investment strategy will meet its objectives or that an investment can avoid losses. It is not possible to invest directly in an index. Exposure to an asset class represented by an index is available through investable instruments based on that index. A client’s investment results are reduced by advisory fees and transaction costs and other expenses.
Employees of Janney Montgomery Scott LLC or its affiliates may, at times, release written or oral commentary, technical analysis or trading strategies that differ from the opinions expressed within. From time to time, Janney Montgomery Scott LLC and/or one or more of its employees may have a position in the securities discussed herein.
About the authors

Chief Investment Strategist, President and Chief Investment Officer, Janney Capital Management
Read more from Mark Luschini

Related Articles
-
Investment Strategy
Behavioral Finance and Investment Principles IV
Part 4: Endowment Effect, Sunk-Cost Fallacy, Illusion of Control. -
Markets & Economics
Healthy Economic Readings Should Support a Positive Earnings Season
Learn more about the latest market and economic news in our Investment Strategy Group’s weekly up... -
Investment Strategy
Behavioral Finance and Investment Principles III
Part 3: Overconfidence, Anchoring Effect, and Herding.

