November Investment Perspectives


That Was Last Quarter
Mark Luschini, Chief Investment Strategist
Economic growth in the third quarter was very strong. A reported (but subject to subsequent revisions) annualized growth rate of 4.9% was more than double the pace of the previous quarter. Even after backing out its most volatile components, inventory restocking and trade, final demand grew a robust 2.1%, quickening at almost twice that of the second quarter. Finally, personal spending, a measure of household consumption, grew 4%, the fastest rate since 2021.
Monetary authorities have raised interest rates 10 times following its initial rate hike in March of last year to a range of 5.25%–5.5%. At approximately two percentage points above headline inflation, it is reasonable that Federal Reserve members consider policy to be restrictive. In other words, rates are sufficiently high to slow the economy enough to draw inflation down to its target level of 2%. However, the economy has yet to buckle. Surely, the mammoth fiscal transfers disbursed during the COVID emergency have elongated the lag between the tightening of monetary policy and the economy measurably slowing.
The Paycheck Protection Program and aid to selected industries helped, but the more material impulse came through the Economic Impact Payments that were sent to households, as well as the supplemental federal unemployment insurance benefits that flowed to many of those who incurred job losses. Another tailwind was the fact that the Federal Reserve buried interest rates near 0% for an extended period, allowing for a brief interlude of rate hikes back in 2016, which were quickly reversed toward the end of 2019. The consequence of their rate hiking campaign starting from a historically low level meant the initial stages of rate increases still maintained a relatively accommodative policy setting through most of 2022, which helped to foster spending and borrowing by both consumers and businesses without much interference.
Now that dynamic is changing, which is why the GDP print for the third quarter will likely mark the high watermark from which economic activity loses steam. After all, the Federal Reserve’s policy setting is restrictive and will likely remain so for quite some time. Plus, the excess savings that accumulated during the pandemic has been whittled down although it is still estimated to be in the hundreds of billions of dollars. To be sure, households in the lowest income quintile have seen those savings mostly drawn down to pre-pandemic balances, but significant sums still reside in the deposits of the four other income quintiles, a cohort that accounts for roughly 90% of the consumer spending thrust. Indeed, excess savings are being depleted and will likely not augment consumption beyond the first half of next year. That should lead to slowing but not an immediate cessation of consumption. In the meantime, however, another drag on forthcoming economic activity is a cooling labor market.
Wage growth remains above trend; however, it’s decelerating, and job creation is likely to slow as recent reports show fewer postings for job openings and company surveys suggest hiring intentions have softened. Collectively, with the excess savings cushion thinning, employment growth on a path to stalling, interest rates around cycle highs, and banks tightening lending standards, we foresee consumers becoming more inclined to retrench than to cull savings excessively or borrow to maintain the recent burst of spending.
Bear markets and recessions have accompanied one another for the last half century, that is until equity investors got spooked last year with premature recession expectations. That led to a precipitous decline in stocks from which a full recovery to the previous peak remains elusive, even as a recession has subsequently failed to materialize. We are constructive on stocks but wary of being over-extended in the event a recession looms out on the not-too-distant horizon.
Historically, the relationship between bear markets and recessions has had a sound fundamental basis since corporate earnings rarely fall meaningfully outside of one. If the Federal Reserve threads the proverbial needle to achieve a soft landing, reducing inflation to a tolerable level without inducing a recession, stocks should resume their upward march and eventually reapproach their January 2022 high. However, if past is prologue, a recession would probably spell another bear market. Such that there are non-trivial odds a recession might occur within the next 12 months, we advocate an investment posture that is congruent with risk management as much as return optimization.
Supply Seemingly Slows
Guy LeBas, Chief Fixed Income Strategist
Selling in long-term Treasuries has been a dominant theme within the U.S. bond markets over the last 12 weeks. Since the first week of August, 10-year Treasury yields are up by 0.85%, while 2-year Treasury yields are up by just 0.16%. While big moves in interest rates almost always have multiple geneses, the most direct cause for this selling was an announcement in the first week that the U.S. Treasury Department would be issuing additional Treasuries to fund the budget deficit in 3Q and 4Q 2023. We wrote about the topic in some detail in our “September Investment Perspectives,” but since that point, supply has taken on more importance.
When it comes to bond supply, it does not usually matter for prices, but it can matter and usually in non-linear ways. Apparently, 2023 is one of those cases. To start, it is worth distinguishing “supply of bonds” from “supply of duration.” Duration is a measure of interest rate risk. When there is an increase in bond supply, a key factor is how long-term— that is, how much duration—the influx of supply is. Shortterm or low-duration bonds are not likely to have much, if any, impact on financial markets. A good example comes from this summer, when the U.S. Treasury began refilling its coffers after the debt ceiling was lifted by issuing lowduration T-bills. There was no material impact on interest rates. In August, however, the bond markets did respond immediately when the U.S. Treasury announced it would be increasing its issuance of longer-duration bonds. Since that point, long-term interest rates have risen considerably while short-term ones have remained little changed.
The reason is that duration is a measure of risk. Short-duration bonds have low risk—that is, their price does not move much on a day-to-day basis—so traders and investors can handle large variations in supply without demanding much lower prices. Long-duration bonds have more interest rate risk—their piece moves much more on a day-to-day basis—so traders and investors demand significantly higher yields to handle a big increase in supply.
Why then, did the Treasury Department increase long-term bond issuance in August if it knew it might trigger a significant increase in interest rates? First, as we briefly argued, it is very hard to know in advance when bond supply will matter for markets. There are plenty of examples in the last decade in which the Treasury increased bond issuance plans without material impact. Second, the U.S. Treasury is not in the business of market timing. In fact, in its bond issuance FAQs, the Office of Debt Management explicitly makes the point that it seeks to fund the budget deficit predictably and without trying to time the markets. It is the Treasury Department’s belief, backed up by considerable economic research, that issuing regularly and predictably will lower borrowing costs over the dozens and dozens of years the U.S. Treasury will be around.
Chart 1: U.S. Treasury Borrowing Est. Revised Downward for 3Q Means Less Bond Supply Than Feared
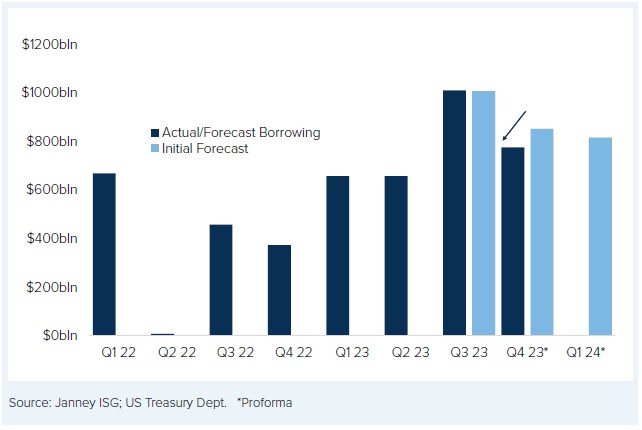
Still, for the moment, markets are hyper-aware of Treasury supply. On October 30, the Treasury issued its quarterly borrowing statement (similar to the aforementioned August statement) for 4Q 2023 and 1Q 2024. That statement, in contrast to the August one, indicated a lower borrowing need than previously forecast, presumably because tax receipts were on the high side. While this announcement does not fully relieve the bond market’s sensitivity to supply, it should hopefully provide a bit of a respite from the relentless pace of rising long-term yields over the last 12 weeks.
‘Tis the Season’ — Part One
Gregory M. Drahuschak, Market Strategist
The last section of the Janney October Investment Perspectives ended by saying, “various technical factors, as well as the seasonal bias, we think suggest that October could provide the setting for increasing equity exposure.” They did, however, not before generating some angst among investors. A rally in the final two days of October left the S&P 500 with a 2.20% loss for the month and its 15th worst October loss since 1950.
Since the S&P 500 January 4, 2022, all-time high, investors have had to endure a particularly difficult environment with one of the most rapid rises in interest rates on record. This eventually led to a yield inversion that often foreshadows recessions.
Chart 2: Ten-Year Treasury Note Yield
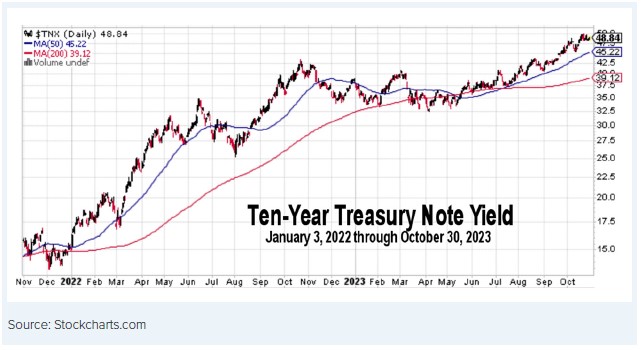
Chart 3: % Inflation Rate 2013–2023
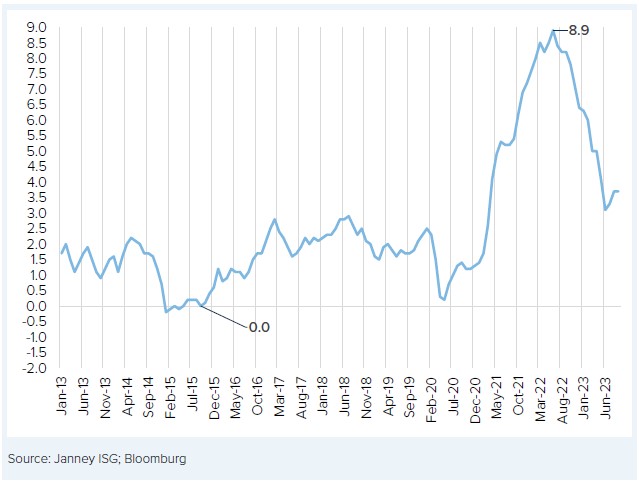
Lingering effects from the pandemic came alongside the Russian invasion of Ukraine. This shook global markets. By September 2022, the S&P 500 had experienced its largest drop since March 2020. In addition, there was the massive rise in the inflation rate.
A nine-month downward spiral dragged the S&P 500 to its 2022 intraday low on October 13 of 3,491.58, which was 27.5% off the high. A rebound in the last half of October and all of November narrowed the losses before the S&P 500 posted its third-worst December since 1950, and the S&P 500 ended with its worst annual drop since 2008, down 19.44%.
2023 began with the market in rally mode. By July 31, the S&P 500 had added 800 points on top of the 2022 close, but many of the same worries that plagued the market in 2022 returned.
The continuing rise in interest rates and the related yield inversion heightened concerns about a possible recession, despite still strong employment data and solid overall consumer sentiment. By June this year, the Conference Board’s overall consumer sentiment index was more than 50% higher than its long-term monthly average. By the end of October, however, the S&P 500 was modestly below where it was at the time of the June sentiment report.
By classic definition, the S&P 500 has had only one bear market since its January 4, 2022, top. Many investors might think there is (at least) a “feels like” bear market following the pullback from the July 27, 2023, peak, as the broad market has lagged significantly behind the capitalization-weighted S&P 500. For example, as October ended, the Invesco S&P 500 Equal Weight ETF (RSP) had a year-to-date loss of 3.84%.
Hope for relief from the recent market weakness in part stems from the fact that four consecutive monthly declines are rare. It has been 12 years since the S&P 500 last suffered through a string of monthly drops this long. In addition, the seasonal bias is skewed heavily to the positive. In the previous 72 years, the S&P 500 has ended higher in November in 50 of those years and it ended higher in December 54 times. Led by the Consumer Discretionary, Industrials, Materials, and Technology sectors, the S&P 500, on average since 1990, gained 6.7% in the November through April period.
Other than the three years of 2000 - 2002, since 1950 the S&P has been down two years in a row only once. Despite all of this year’s turmoil, in our view, the S&P 500 will not be the second example of back-to-back down years.
At the end of October, the S&P 500 had a 9.23% year-to-date gain. A rally helped by seasonal factors, the still good economy, and the nearness of the time when the Federal Reserve stops raising interest rates, could help add to the gain as we move toward 2024. Regaining its most recent high around 4600, however, will be challenging.
The information herein is for informative purposes only and in no event should be construed as a representation by us or as an offer to sell, or solicitation of an offer to buy any securities. The factual information given herein is taken from sources that we believe to be reliable, but is not guaranteed by us as to accuracy or completeness. Charts and graphs are provided for illustrative purposes. Opinions expressed are subject to change without notice and do not take into account the particular investment objectives, financial situation or needs of individual investors.
The concepts illustrated here have legal, accounting, and tax implications. Neither Janney Montgomery Scott LLC nor its Financial Advisors give tax, legal, or accounting advice. Please consult with the appropriate professional for advice concerning your particular circumstances. Past performance is not an indication or guarantee of future results. There are no guarantees that any investment or investment strategy will meet its objectives or that an investment can avoid losses. It is not possible to invest directly in an index. Exposure to an asset class represented by an index is available through investable instruments based on that index. A client’s investment results are reduced by advisory fees and transaction costs and other expenses.
Employees of Janney Montgomery Scott LLC or its affiliates may, at times, release written or oral commentary, technical analysis or trading strategies that differ from the opinions expressed within. From time to time, Janney Montgomery Scott LLC and/or one or more of its employees may have a position in the securities discussed herein.
About the authors

Chief Investment Strategist, President and Chief Investment Officer, Janney Capital Management
Read more from Mark Luschini

Related Articles
-
Investment Strategy
Behavioral Finance and Investment Principles IV
Part 4: Endowment Effect, Sunk-Cost Fallacy, Illusion of Control. -
Markets & Economics
Healthy Economic Readings Should Support a Positive Earnings Season
Learn more about the latest market and economic news in our Investment Strategy Group’s weekly up... -
Investment Strategy
Behavioral Finance and Investment Principles III
Part 3: Overconfidence, Anchoring Effect, and Herding.

