December Investment Perspectives


Going Nuclear
Mark Luschini, Chief Investment Strategist
Nuclear power plants that were shuttered or projects that were mothballed after the disaster in the Japanese city of Fukushima back in 2011 have, in many cases, been reopened or planned to restart. Dissipating concerns about another incident, coupled with increased recognition that nuclear energy can provide an important and stable power source to the electric grid, have revived interest in its deployment and expansion. Indeed, new projects are either underway or being contemplated to expand the nuclear fleet, causing the demand for uranium to rise.
Among metals in the commodity complex, uranium, with the atomic number 92 and the chemical symbol U, has had one of the most spectacular increases in price this year. On an absolute basis, uranium prices are reaching levels last seen about 15 years ago, as decisions on new nuclear plants in Europe, as well as the extension of numerous existing reactor lifespans, are brightening the outlook for the yellow metal. This metal, which fuels zero-carbon nuclear power generation, continues to enjoy a tailwind on the back of shifting sentiment toward nuclear as a supplement to the world’s energy needs.
The price increase, driven by the improving demand picture, is being amplified by continual tightness on the supply side. The capacity limitation to produce uranium was spurred by years of miners cutting back production during the last decade, precipitated by the clouded outlook for nuclear energy’s future.
Recent data from the World Nuclear Association indicated that demand for uranium in nuclear reactors is expected to continue to climb at a rapid pace for years to come. Europe is a case study for the resurrection of nuclear power, having enacted policies to combat climate change by reducing greenhouse gas emissions. The European Commission’s focus on green energy projects includes nuclear power as a critical part of its plans to meet its goal of net zero greenhouse gas emissions.
While many of Europe’s nuclear power plants are decades old, refurbishing these facilities could enable them to operate for many more decades, with sufficient investment, which would augment the need for uranium to service these facilities for years to come. In addition, France is preparing to make decisions on the construction of as many as 14 new reactors that could launch during the next half-decade. Already, France has boosted its nuclear generation enough to become a top power exporter across Europe. This, in turn, has played a critical role in combating the spike in energy prices coming in the wake of Russia’s invasion of Ukraine. The supply side is also helping to support higher prices.
Procurement has become more complex due to geopolitical developments. For instance, Russian-supplied uranium could be jeopardized by the ongoing conflict in Eastern Europe, and Niger, Africa’s second-biggest uranium producer, is currently in a kinetic political state wrought with uncertainty.
The adage “the cure to high commodity prices is high commodity prices” is a generalization, but it means that the demand destruction caused by excessively inflated costs eventually leads to a diminution of demand. Obviously, as demand is destroyed, prices come down. Just the same then, the cure for low prices in the commodity complex is low prices, as capacity is worked off, causing a supply shortage as demand eventually outstrips production, boosting prices. In our view, that scenario is not only the case today for uranium, but many other metals such as copper and lithium. The latter is being driven by the same decarbonization movement but especially pertaining to the rapidly growing adoption of electric vehicles. We are constructive on the secular forces behind the increased demand for industrial metals. As such, we will be writing more on this subject in future publications.
What’s Politics Got to Do With It?
Guy LeBas, Chief Fixed Income Strategist
Politics have crept, drifted, or been forced into nearly every aspect of the news in the last decade. Not surprisingly, the same can be said about the news regarding the financial markets. While the private sector is easily the largest piece of the U.S. economy, public sector activity nonetheless suffuses many aspects of economy. Public sector entities that interface directly with the financial markets, including the Federal Reserve (Fed) and Treasury Department, have faced accusations of political influence for years, some accurate, some exaggerated.
The Fed and its Federal Open Market Committee (FOMC) have a unique structure among central banks. The FOMC, which establishes monetary policy, includes 12 voting members. Seven members are governors nominated by the President and confirmed by Congress, while the remaining five members come from the regional Federal Reserve banks. Given that the majority of FOMC voters are appointees, some degree of political influence seems natural. But, the 14-year terms for appointments limit political influence. For example, Fed Chair Jay Powell, who describes himself as Republican, was initially appointed by a Democrat president and has served through three very different presidential administrations. By all internal accounts, the Fed’s culture is very apolitical.
Chart 1: Federal Reserve Policy in Election Years
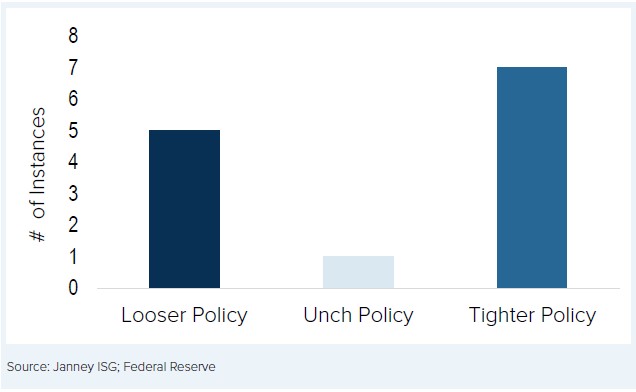
A good “test” of the Fed’s political nature is how the institution behaves in presidential election years. There is a pervasive myth that the Federal Reserve “works” for the in-power administration and therefore avoids actions in election years that could harm economic growth. If this myth were true, one would expect the Fed’s target for overnight rates would decline or remain unchanged in most election years. Since the Fed first began using the Fed funds rate in 1972, there have been 13 presidential elections. In seven of those years the Fed raised rates; in one year they held unchanged; and in five years the Fed cut rates. More robust versions of the same test return the same result. If we just check the six months leading up to presidential elections since 1972, the Fed has hiked in five of those periods, held unchanged in five, and cut rates in three. In other words, there is no obvious connection between Fed policy and presidential elections, despite the pervasive myth otherwise.
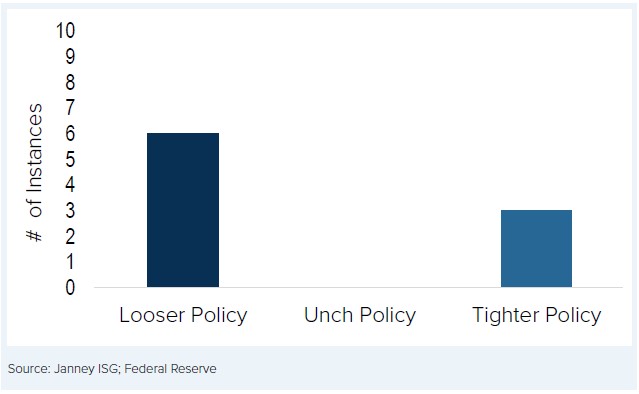
Other governmental entities do tend to play games around election years, although anecdotally, those games seem to impact equity markets more than fixed income. The Treasury Department, for one, has substantial leeway in how it finances Congress’ spending plans. The Treasury issues enough debt to hold cash in the Treasury General Account (TGA) to cover regular in- and out-flows of cash, but the size of the account is left to the discretion of Treasury officials. In theory, increases in the TGA pull liquidity out of financial markets, while decreases in the TGA add liquidity to financial markets and the economy.
Historically, Treasury secretaries have used this knowledge to boost markets and the economy in election years. Since the advent of the TGA, the Treasury has released liquidity into the economy six years and pulled it away only three (excluding the Global Financial Crisis and COVID years). The trend is even more obvious in only the final quarter of election years. In that quarter, the Treasury has added liquidity to markets and the economy nine times and pulled it away just once.
Chart 2: Treasury TGA Policy in Election Years
For better or worse, politics permeates nearly all of life in the current era. Markets themselves seem to have become more politicized as well. But we have a tendency for investors to exaggerate just how big a role politics plays (theoretically) in objective decision-making. The Federal Reserve, in particular, is often the subject of politicking accusations, but the reality is that at least that organization has a long history of political independence as well as the institutional guardrails to avoid undue outside influence.
’Tis the Season — Part Two
Gregory M. Drahuschak, Market Strategist
On the heels of one of the best months in decades and the fourth best November in the last 73 years, the second of the typically strong year-end months dawns, with hope that December’s seasonally positive bias can lift the S&P 500 beyond 4600.
November’s positive market came despite still lackluster economic data. The ISM Manufacturing and Service measures were lower than anticipated. The Philadelphia Federal Index beat expectations but was still in negative territory. Industrial production fell 6%, while new and existing home sales data fell well short of expectations. The National Association of Home Builders (NAHB) Housing Market Index dropped for the fourth straight month to its lowest level in a year.
Nonetheless, the equity market took its cue from the Consumer Price Index (CPI), which was unchanged month-over-month, and on a year-over-year basis, the total CPI was up 3.2% versus 3.7% in September. The core CPI was up 4.0%, the smallest 12-month change in core CPI since September 2021. After falling only three basis points shy of 5% for the 10-year Treasury note, interest rates across the yield curve fell in anticipation that the Federal Reserve’s next rate move might be to cut the Fed fund target range.
Chart 3: 10-Year Treasury Note Rate
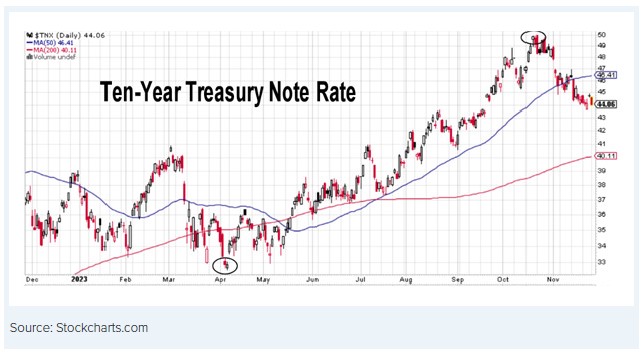
After the recent rate regiment shoved interest rates up more than 53% above the April 6, 2023, low, the Federal Reserve Open Market Committee’s decision on November 1, 2023, to hold the Fed fund target range at 5-1/4 to 5-1/2% was all the market needed to head higher. The S&P closed higher in 16 of the 21 trading sessions in November.
Throughout 2023, there has been persistent commentary that a recession is not only likely but might be right around the corner. Nonetheless, according to the second estimate for the third quarter, a strong labor market and disinflation that fueled healthy consumer spending increased real Gross Domestic Product at an annual rate of 5.2%. In our view, it is highly unlikely that GDP growth in the current quarter will match the third-quarter growth rate, but barring a significantly adverse event, economic growth this quarter should remain solid.
December’s reputation as a strongly market-friendly month is largely true, but trading often is choppy through the first half of the month. The sharp upward move in the S&P 500 thrust it into a technically overbought condition that might be a headwind for part of December. Still, various levels of potential support should help the market resist a significant downward move.
Each December, it is not sugar plums dancing in investors’ heads but rather thoughts that Santa will make a stop on Wall Street.
Of the 73 years from 1950-2022, the S&P 500 has ended higher in December in 54 years (April has the next highest frequency of S&P 500 gains, two years less than December), but tax adjustments by major institutions often produce first-half choppiness. This typically ends around December 10. The so-called “Santa Claus rally” period kicks in during the final five trading days of the year and the first two trading days of the next year when stocks tend to work higher.
Although the seasonal bias might dominate the market this month, investors will keep a keen eye on 2024 earnings prospects. The current 2024 consensus earnings estimate has fallen in 10 of the last 12 weeks. Suggesting that 2024 earnings will rise more than 11% next year leaves little room for error. Be alert this month for companies offering advance indications of what they anticipate their earnings will be.
The information herein is for informative purposes only and in no event should be construed as a representation by us or as an offer to sell, or solicitation of an offer to buy any securities. The factual information given herein is taken from sources that we believe to be reliable, but is not guaranteed by us as to accuracy or completeness. Charts and graphs are provided for illustrative purposes. Opinions expressed are subject to change without notice and do not take into account the particular investment objectives, financial situation or needs of individual investors.
The concepts illustrated here have legal, accounting, and tax implications. Neither Janney Montgomery Scott LLC nor its Financial Advisors give tax, legal, or accounting advice. Please consult with the appropriate professional for advice concerning your particular circumstances. Past performance is not an indication or guarantee of future results. There are no guarantees that any investment or investment strategy will meet its objectives or that an investment can avoid losses. It is not possible to invest directly in an index. Exposure to an asset class represented by an index is available through investable instruments based on that index. A client’s investment results are reduced by advisory fees and transaction costs and other expenses.
Employees of Janney Montgomery Scott LLC or its affiliates may, at times, release written or oral commentary, technical analysis or trading strategies that differ from the opinions expressed within. From time to time, Janney Montgomery Scott LLC and/or one or more of its employees may have a position in the securities discussed herein.
About the authors

Chief Investment Strategist, President and Chief Investment Officer, Janney Capital Management
Read more from Mark Luschini

Related Articles
-
Investment Strategy
Behavioral Finance and Investment Principles IV
Part 4: Endowment Effect, Sunk-Cost Fallacy, Illusion of Control. -
Markets & Economics
Healthy Economic Readings Should Support a Positive Earnings Season
Learn more about the latest market and economic news in our Investment Strategy Group’s weekly up... -
Investment Strategy
Behavioral Finance and Investment Principles III
Part 3: Overconfidence, Anchoring Effect, and Herding.

